Percentile Analysis report
Overview
This report shows a number of key performance metrics for selected teams and highlights their Latent Capacity at a target percentile of Productivity (i.e. the amount of time they would have gained if they had worked at that percentile). It also shows how closely Work In and Productivity are correlated.
This report shows how much potential time could be available and work that could be completed if the current Productivity were stabilised, encouraging the best practise of the AOM method. It also helps team leaders to monitor how successfully the implementation of AOM is breaking the link between Work In and Productivity.
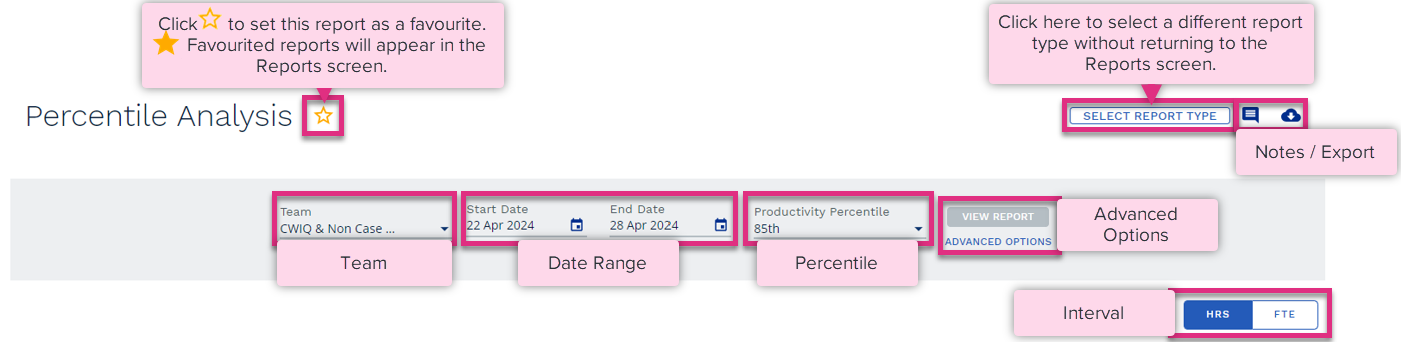
Team
Date Range
Percentile
Advanced Options
Interval
Notes / Export
|
 You can add notes the report using this icon .
 Export the report to Excel using this icon. This will export the data displayed on the screen in the key metrics table. If you require team level data, be sure to expand the data before exporting.
Latent capacity details the proportion of the team's Core Time that would have become available to them if they had consistently worked at the level of Productivity selected in the Productivity Percentile field when running the report. Fluctuating daily performance will impact the amount of Latent capacity within each workgroup.
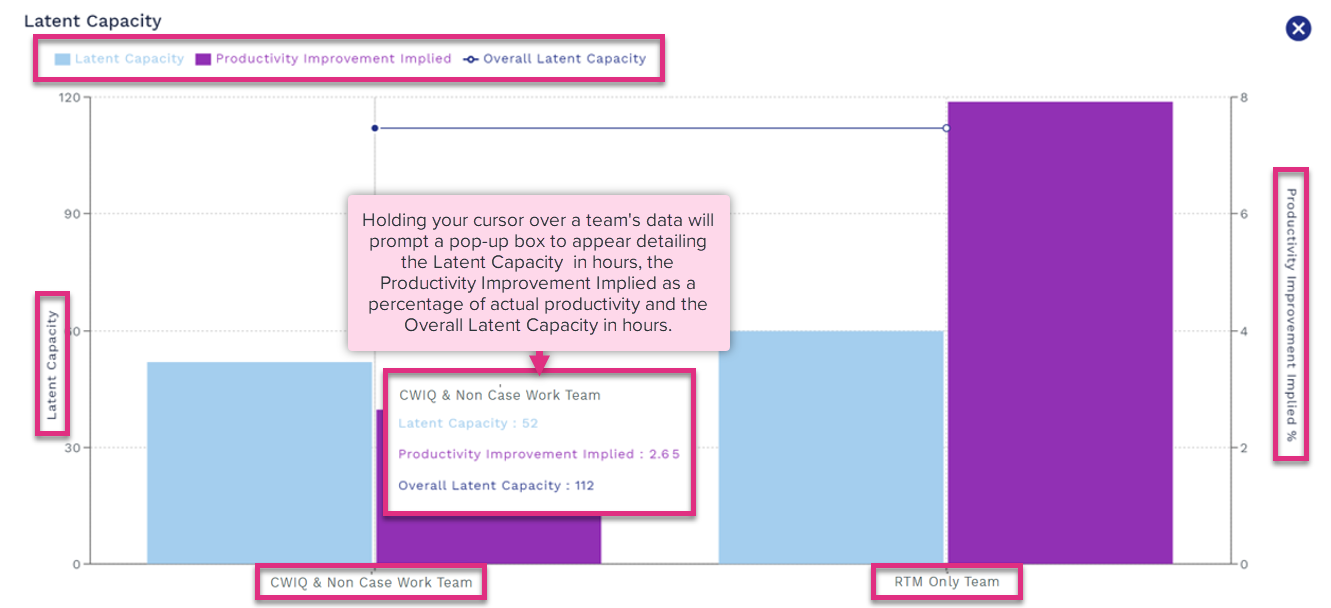
For each team included in the workgroup selected when running the report, the chart will detail the:
-
Latent Capacity, additional capacity that would have been available for the team to utilise if they had maintained daily performance at the percentile value selected when running the report. The chart displays Latent Capacity in hours.
-
Productivity Improvement Implied, the percentage increase to the actual productivity achieved that could have been achieved had actual productivity stabilised at the percentile value selected when running the report.
The chart will also illustrate the Overall Latent Capacity in hours for the workgroup over the period being reviewed.
The key metrics table displays metrics relating to workload, performance and opportunity for the selected workgroup and each child workgroup for the reporting period. The metrics displayed at the highest level represent the entire reporting period, but each team can be expanded to view this data by day.
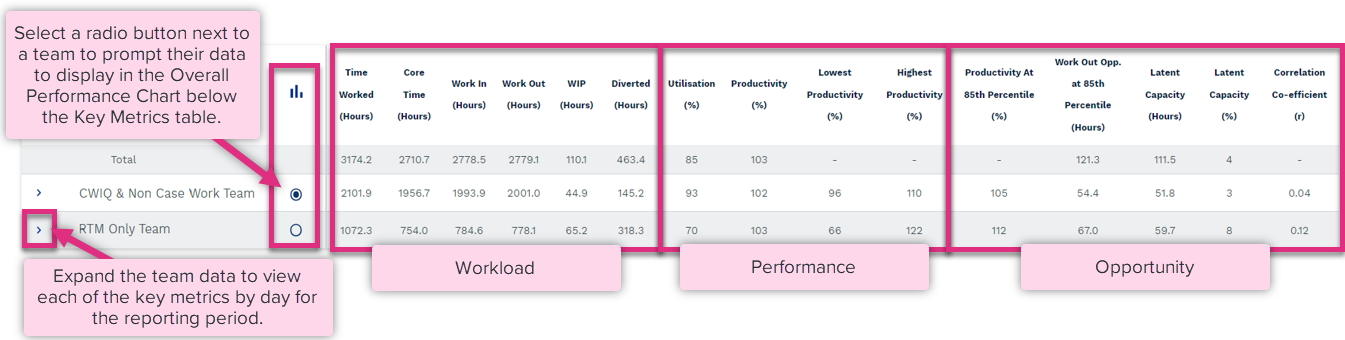
Workload
Time Worked (Hours)
Core Time (Hours)
Work In (Hours)
Work Out (Hours)
WIP (Hours)
Diverted (Hours)
|
Performance
Utilisation (%)
Productivity (%)
Lowest Productivity (%)
Highest Productivity (%)
|
Opportunity
Productivity At 85th Percentile (%)
Work Out Opp. At X Percentile (Hours)
Latent Capacity (Hours)
Latent Capacity (%)
Correlation Co-efficient (r)
|
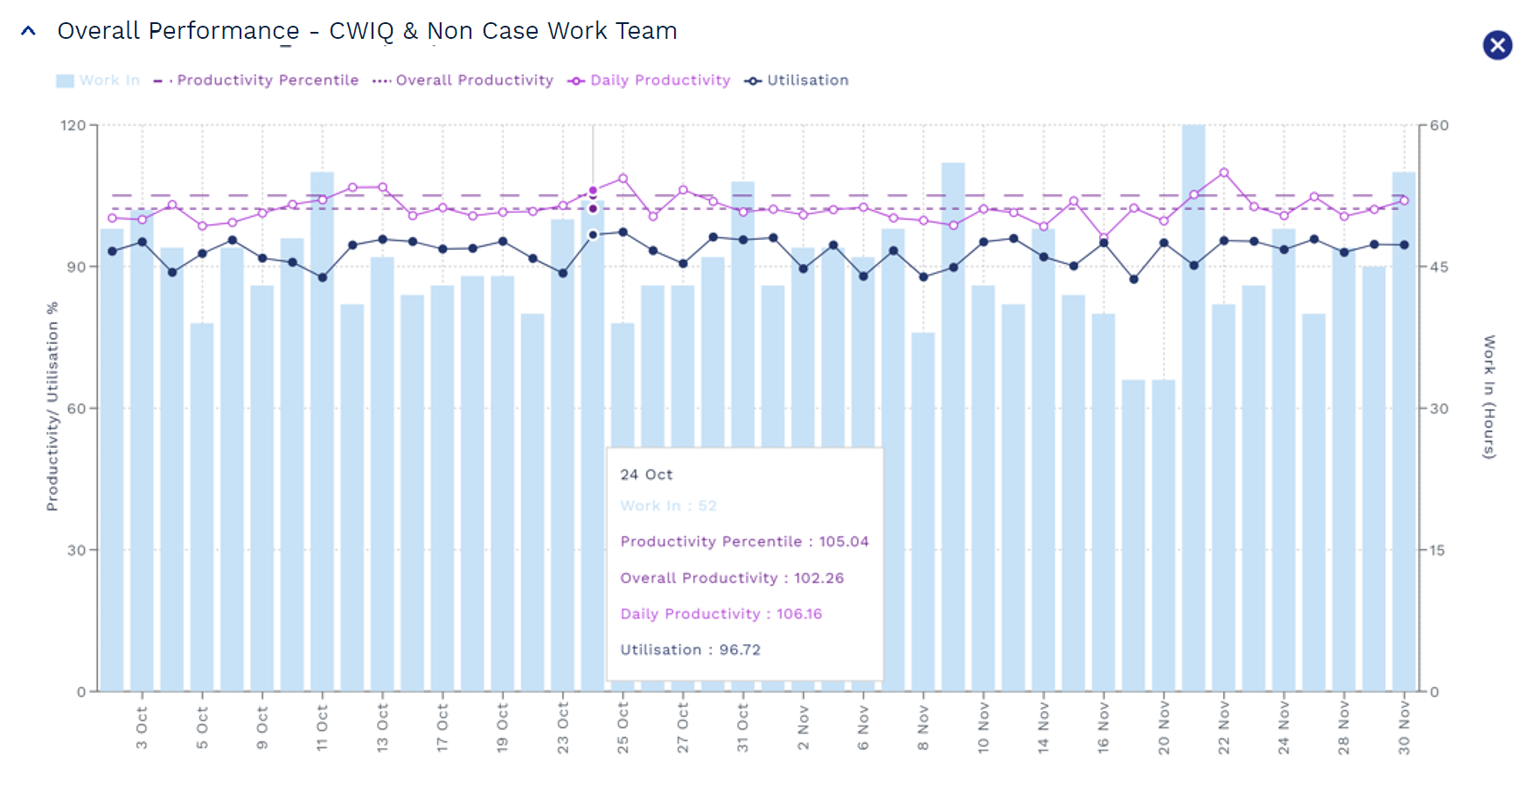
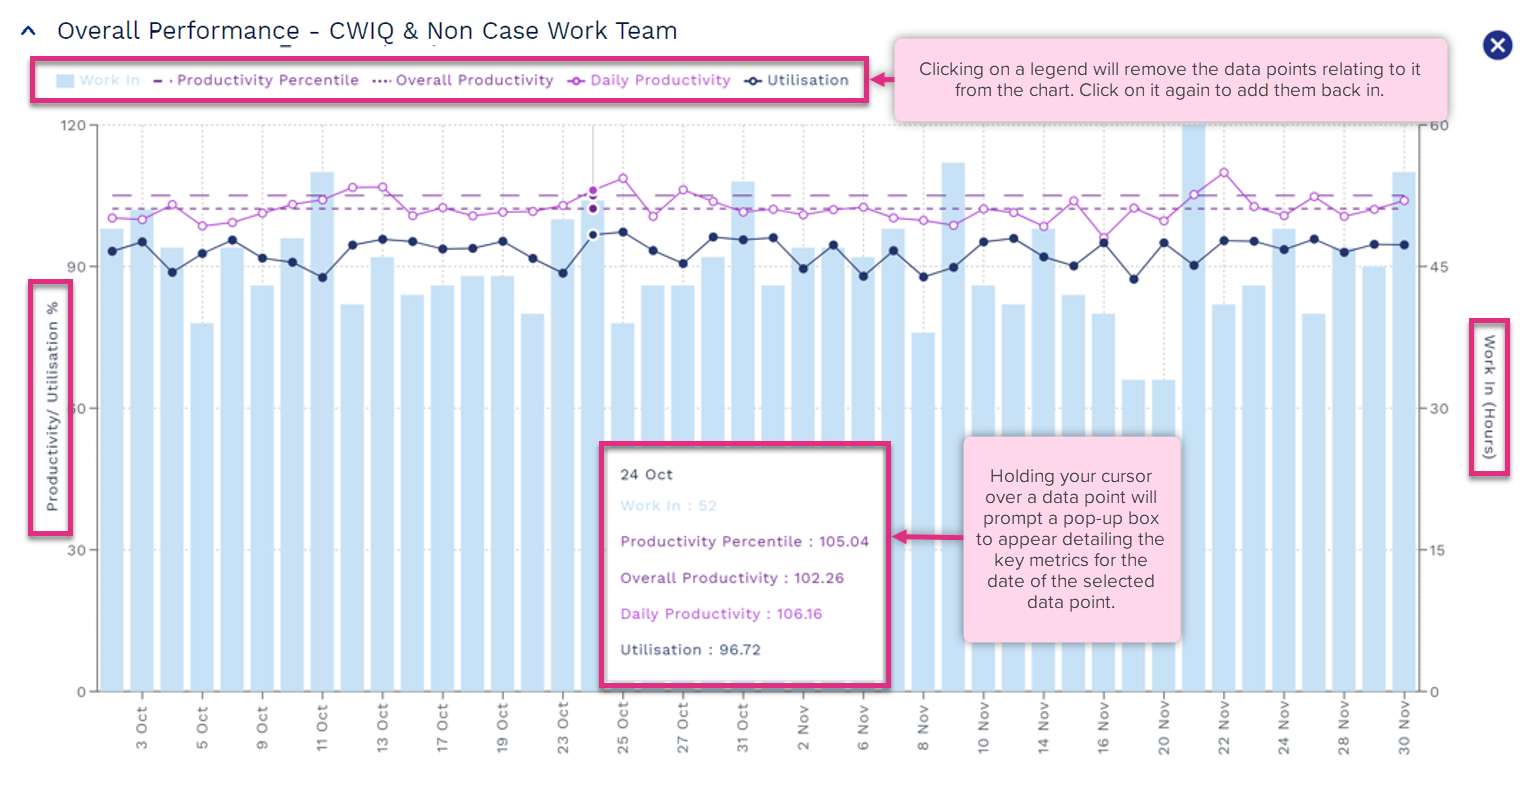
This chart combines a bar graph with a line graph to show measures of overall performance for the workgroup selected in the Key Metrics table above.
|
The chart illustrates the following metrics by day for the period being reviewed:
-
Work In illustrates the total new work received by the workgroup during the period being reviewed based on items received x standard time for all the workgroups core tasks.
-
Productivity Percentile illustrates the productivity percentile value selected when running the report allowing for comparison between this value and the actual daily or overall Productivity.
-
Overall Productivity illustrates the actual Productivity achieved by the workgroup across the entire period being reviewed. This is an actual calculation based on Work Out/Core Time for the whole reporting period.
-
Daily Productivity illustrates the actual Productivity achieved by the workgroup by day for the reporting period allowing for comparison between the selected Productivity Percentile value and a view of daily variation.
-
Utilisation illustrates the actual Utilisation value for the workgroup for each day included in the reporting period.
| For more information on... | |
|---|---|
| Percentile Analysis Video | Percentile Analysis Video |
|
Calculations |
See Key Equations |
| Frequently Asked Questions | See FAQs |
| Video Library | See Video Library |


